Zabbix for Comprehensive Open Source Monitoring Solutions
For businesses to succeed in today’s landscape, it is crucial to continuously monitor their information technology infrastructure and server performances.
In this regard, utilizing the open-source monitoring and alarm system called Zabbix provides an effective solution for many organizations. Known for its features such as server and infrastructure monitoring, custom metric monitoring, database transaction monitoring, and service monitoring, Zabbix offers a wide range of capabilities.
Zabbix is an open-source network and system monitoring solution. This software enables organizations to consistently monitor, evaluate performance, and proactively identify potential issues within their IT infrastructure. It is renowned for its extensive monitoring capabilities, flexible configuration options, and robust notification systems.
Key features include:
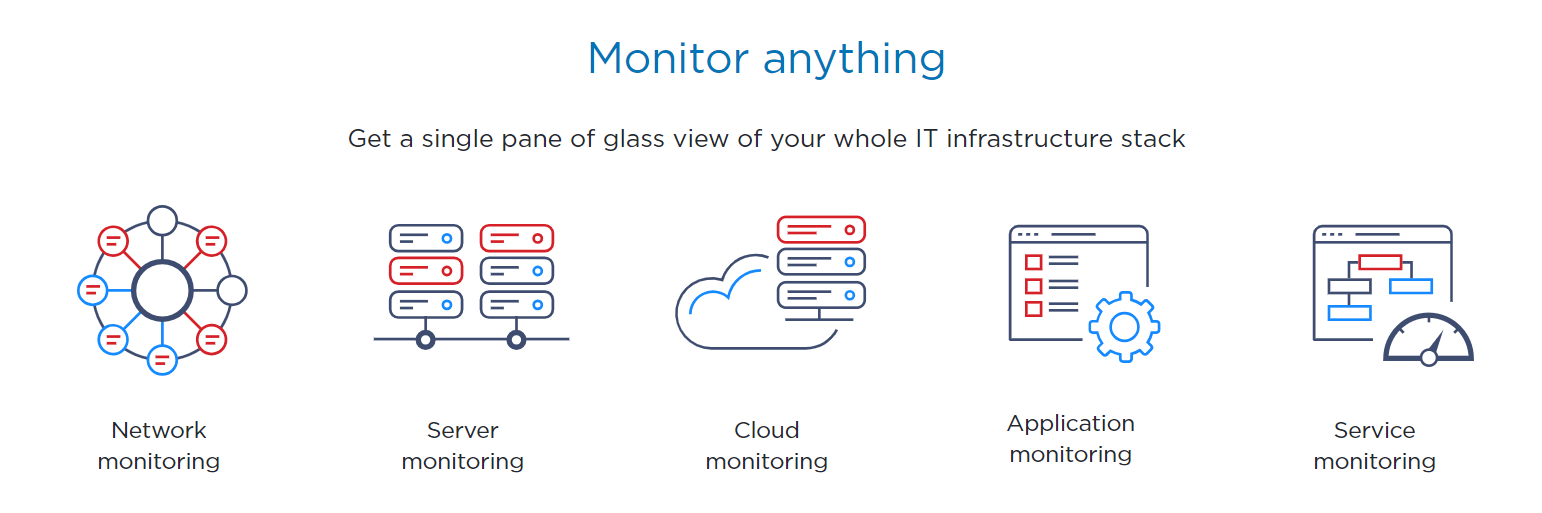
Server and Infrastructure Monitoring
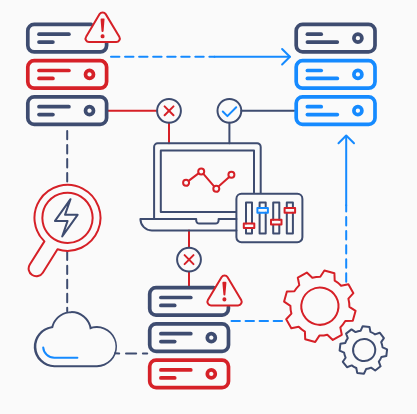
Zabbix can monitor the performance of servers (Windows, Linux, UNIX, etc.) using Zabbix Agent. It can detect performance issues by monitoring parameters such as CPU usage, memory usage, disk space, and network traffic.
The collected data can be visualized for analysis through graphs, tables, and reports. Dashboards can be created to monitor data from a single screen.
It sends notifications based on defined threshold values and manages events. For example, it can send a notification when the CPU usage of a specific server exceeds 90%.
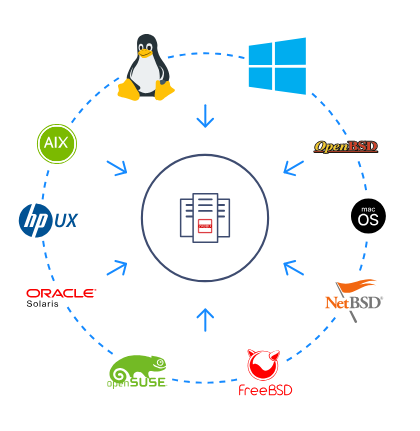
Zabbix Agent Monitoring
Zabbix Agent collects performance data from a device and sends it to the Zabbix server. The high-performance Agent works on Windows, macOS, Solaris, AIX, BSD, and various Linux distributions. It can report to multiple servers, ensuring smooth operation in high-availability architectures. It has features like remote command execution and script triggering.
Zabbix Agent 2 plugins allow effortless monitoring of SSL Certificate Checks, PostgreSQL, and MongoDB metrics.
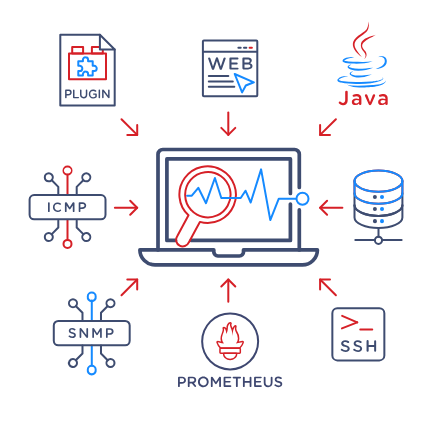
Agentless Monitoring
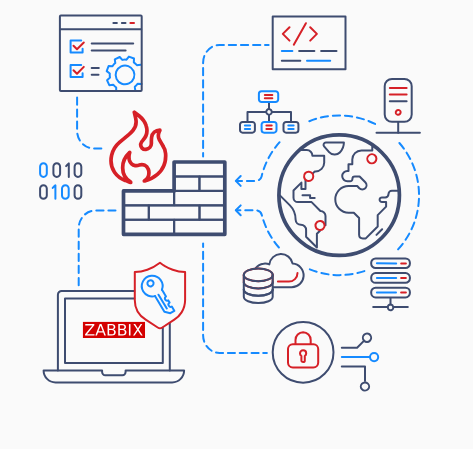
Zabbix offers agentless monitoring options when Zabbix Agent cannot be installed. It supports URL monitoring, SNMP, ODBC monitoring, ICMP and TCP checks, monitoring via API endpoints, Java Application Monitoring, executing commands on servers via SSH, and more.
Custom Metric Monitoring
Zabbix allows organizations to define and monitor custom metrics beyond general monitoring features. It enables users to define and monitor their own custom metrics, meeting specific measurement needs.
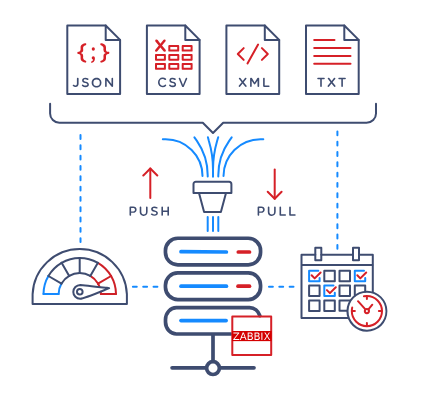
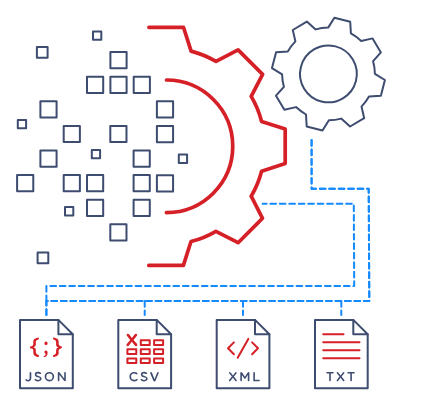
For example, it highlights its flexibility in scenarios like monitoring the performance metrics of a custom application via API or tracking SNMP-based network traffic for a custom protocol. Custom metrics can be monitored by running commands through SSH connections or Zabbix Agent, and data from JSON, CSV, XML, TXT files can be tracked.
Data Transformation/Manipulation
Any metric monitored in Zabbix can undergo preprocessing. This means that data can be manipulated using functions such as Regular Expression (Regex), replace, trim, or directly with JavaScript code.
Database Transaction Monitoring
Zabbix allows detailed monitoring of database performance with its database transaction monitoring feature. It can monitor the performance of database servers (MySQL, PostgreSQL, Oracle, SQL Server, etc.) via Zabbix Agent 2 or ODBC Driver.
Network Monitoring
Zabbix can monitor network devices (routers, switches, etc.) and network protocols via SNMP and API. It monitors metrics such as traffic in network connections, connection status, ping response time, port checks, and packet loss.
Service Monitoring
Zabbix is used to monitor the status of services essential for ensuring business continuity, such as web servers, email servers, DNS services, etc. It continuously checks the operational status of various services, and in case of any errors, triggers automatic alerts or responses.
This enables the prediction of service interruptions and effective intervention by organizations.
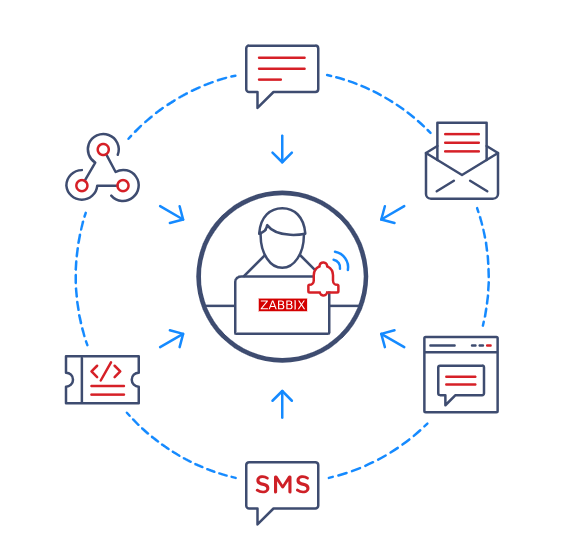
Notifications and Actions
Zabbix allows various actions to be taken on metrics that have alarm definitions created for them, either instantly or after a specific period when a metric reaches/exceeds a certain threshold.
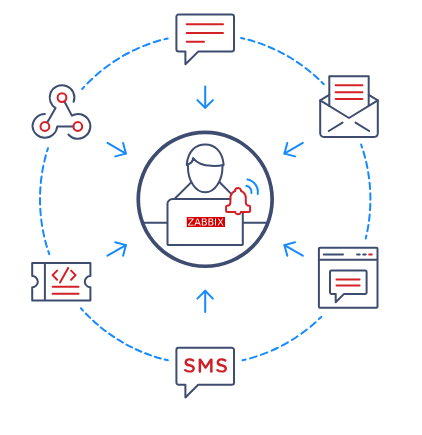
Actions can notify relevant users or user groups through various platforms such as email, Slack, MS Teams, Telegram, or integrate with ITSM products like Jira, ServiceNow, Zendesk, etc.
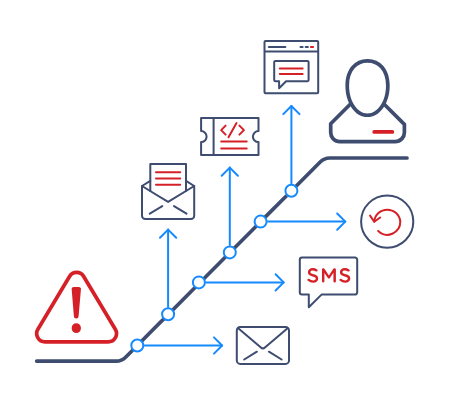
Notifications and actions continue to operate with intervals specified as long as the alarm persists, following an escalation structure.
Dashboard
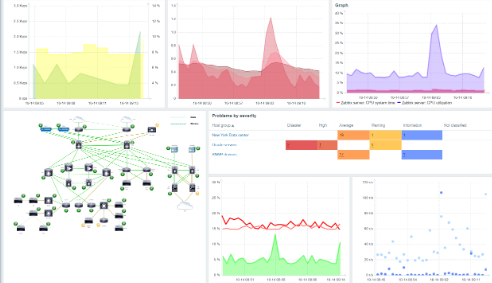
The data being monitored on Zabbix can be tracked by creating a dashboard. These dashboards can be public or restricted to individuals or teams. Existing dashboards can be periodically obtained as PDF reports and communicated to relevant individuals or teams with notifications.

On the dashboard screens, alarms related to specific servers or server groups, servers with the highest CPU and memory usage, can be listed.
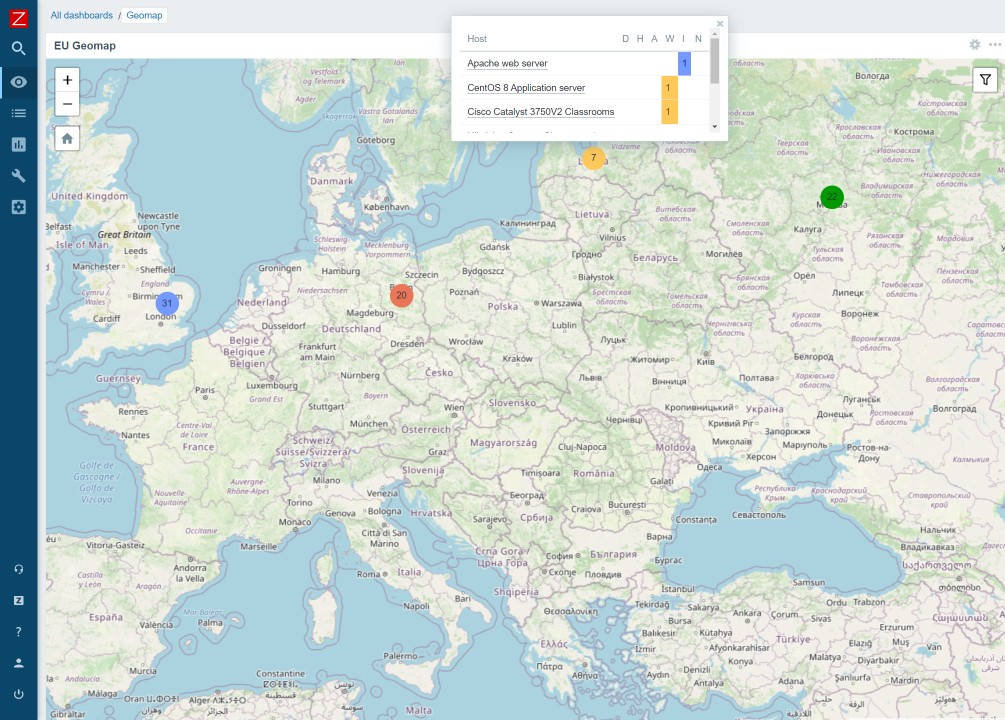
Servers can be displayed on the map according to their locations using Geomap.
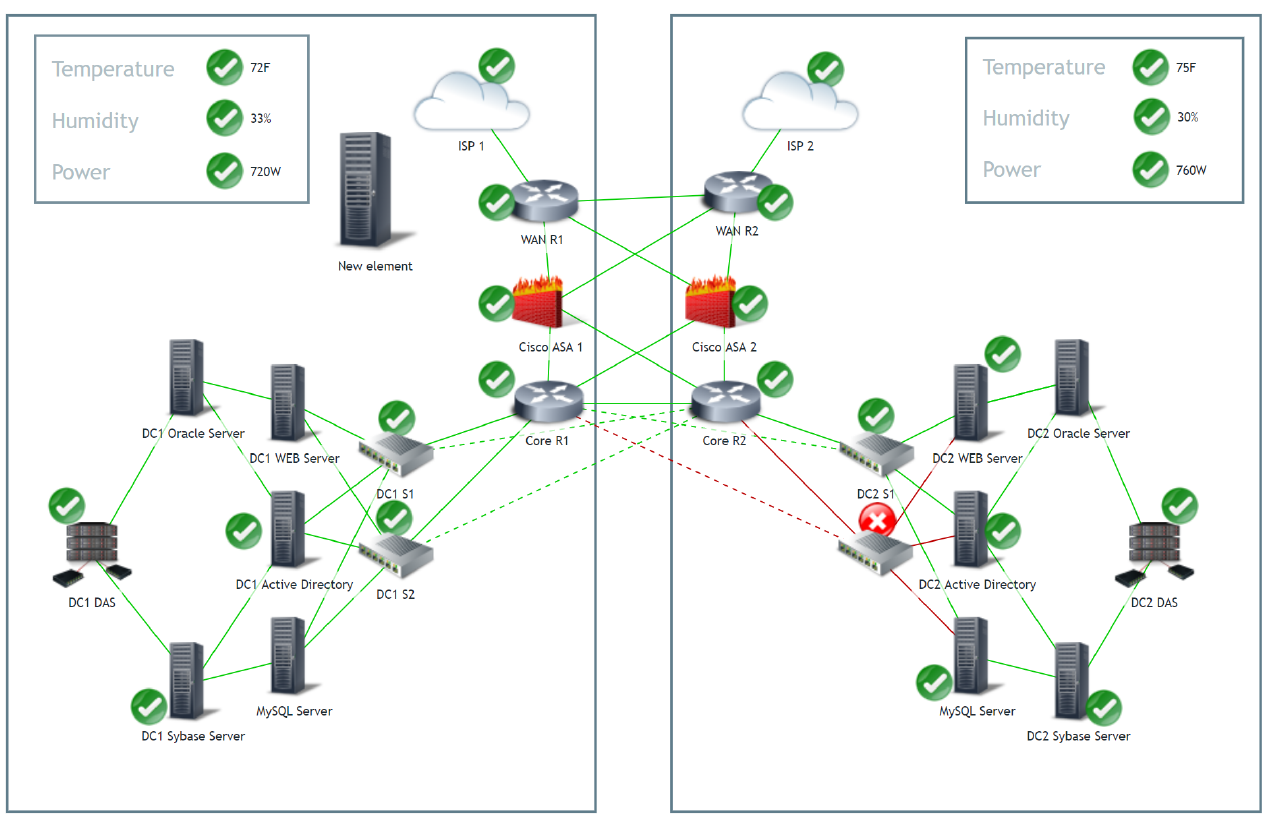
Connections and topology between servers can be drawn using Infrastructure Map.
The existing Zabbix Server Health dashboard allows easy monitoring of controls related to the Zabbix server from a single screen.
Zabbix API
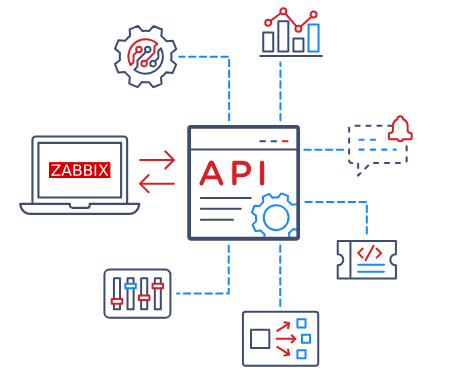
Zabbix can easily integrate with other systems using its API. Historical data and alarms from Zabbix can be transferred to applications like Grafana via the API. Workflows can be automated. For example, all existing alarms can be closed every Monday. Servers, server groups, etc., can be created automatically.
These operations can be securely performed by creating an API token. Zabbix API has rich content with more than 200 methods.
Zabbix Usage in Projects
Zabbix offers a valuable tool for project managers and teams. By monitoring the performance of servers used in projects, it is possible to optimize resource usage and predict potential issues in advance.
The Zabbix server can work in PostgreSQL or MySQL databases according to the relevant architecture. Apache or nginx can be used for the front-end.
Zabbix’s native High Availability structure can be configured according to the project’s architecture, with servers set up in an active-passive configuration. When an issue arises on the active server, the passive server automatically becomes active, ensuring continuous monitoring without any loss.
High Availability can be set up during the initial installation or later on. When necessary, the existing structure can be smoothly expanded by adding a new node.
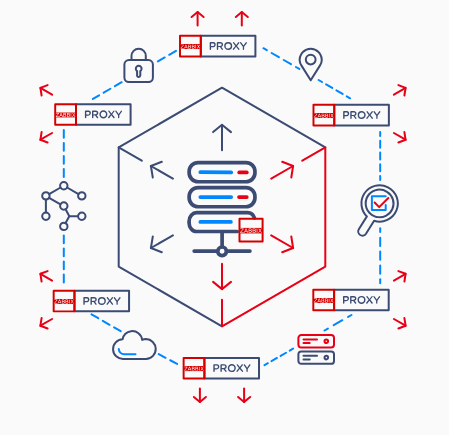
For environments without direct access to the Zabbix server (firewall, DMZ), Zabbix Proxy Server can be installed to redirect monitoring to Zabbix Proxy. Zabbix Server communicates only with Zabbix Proxy.
Zabbix Proxy is also used for scaling. The number of metrics and servers that Zabbix Server can monitor is significantly increased with Zabbix Proxy servers.
Moreover, the custom metric monitoring feature, which can be customized according to the requirements of special projects, can respond more effectively to the specific needs of projects.
By tracking database processes within project workflows, potential issues in database-based applications can be quickly detected.
With Zabbix’s extensive alarm and notification mechanisms, project teams can respond quickly, ensuring maximum project continuity.
Therefore, Zabbix plays a critical role in successfully managing projects and contributes to the secure and efficient operation of the information infrastructure of projects.