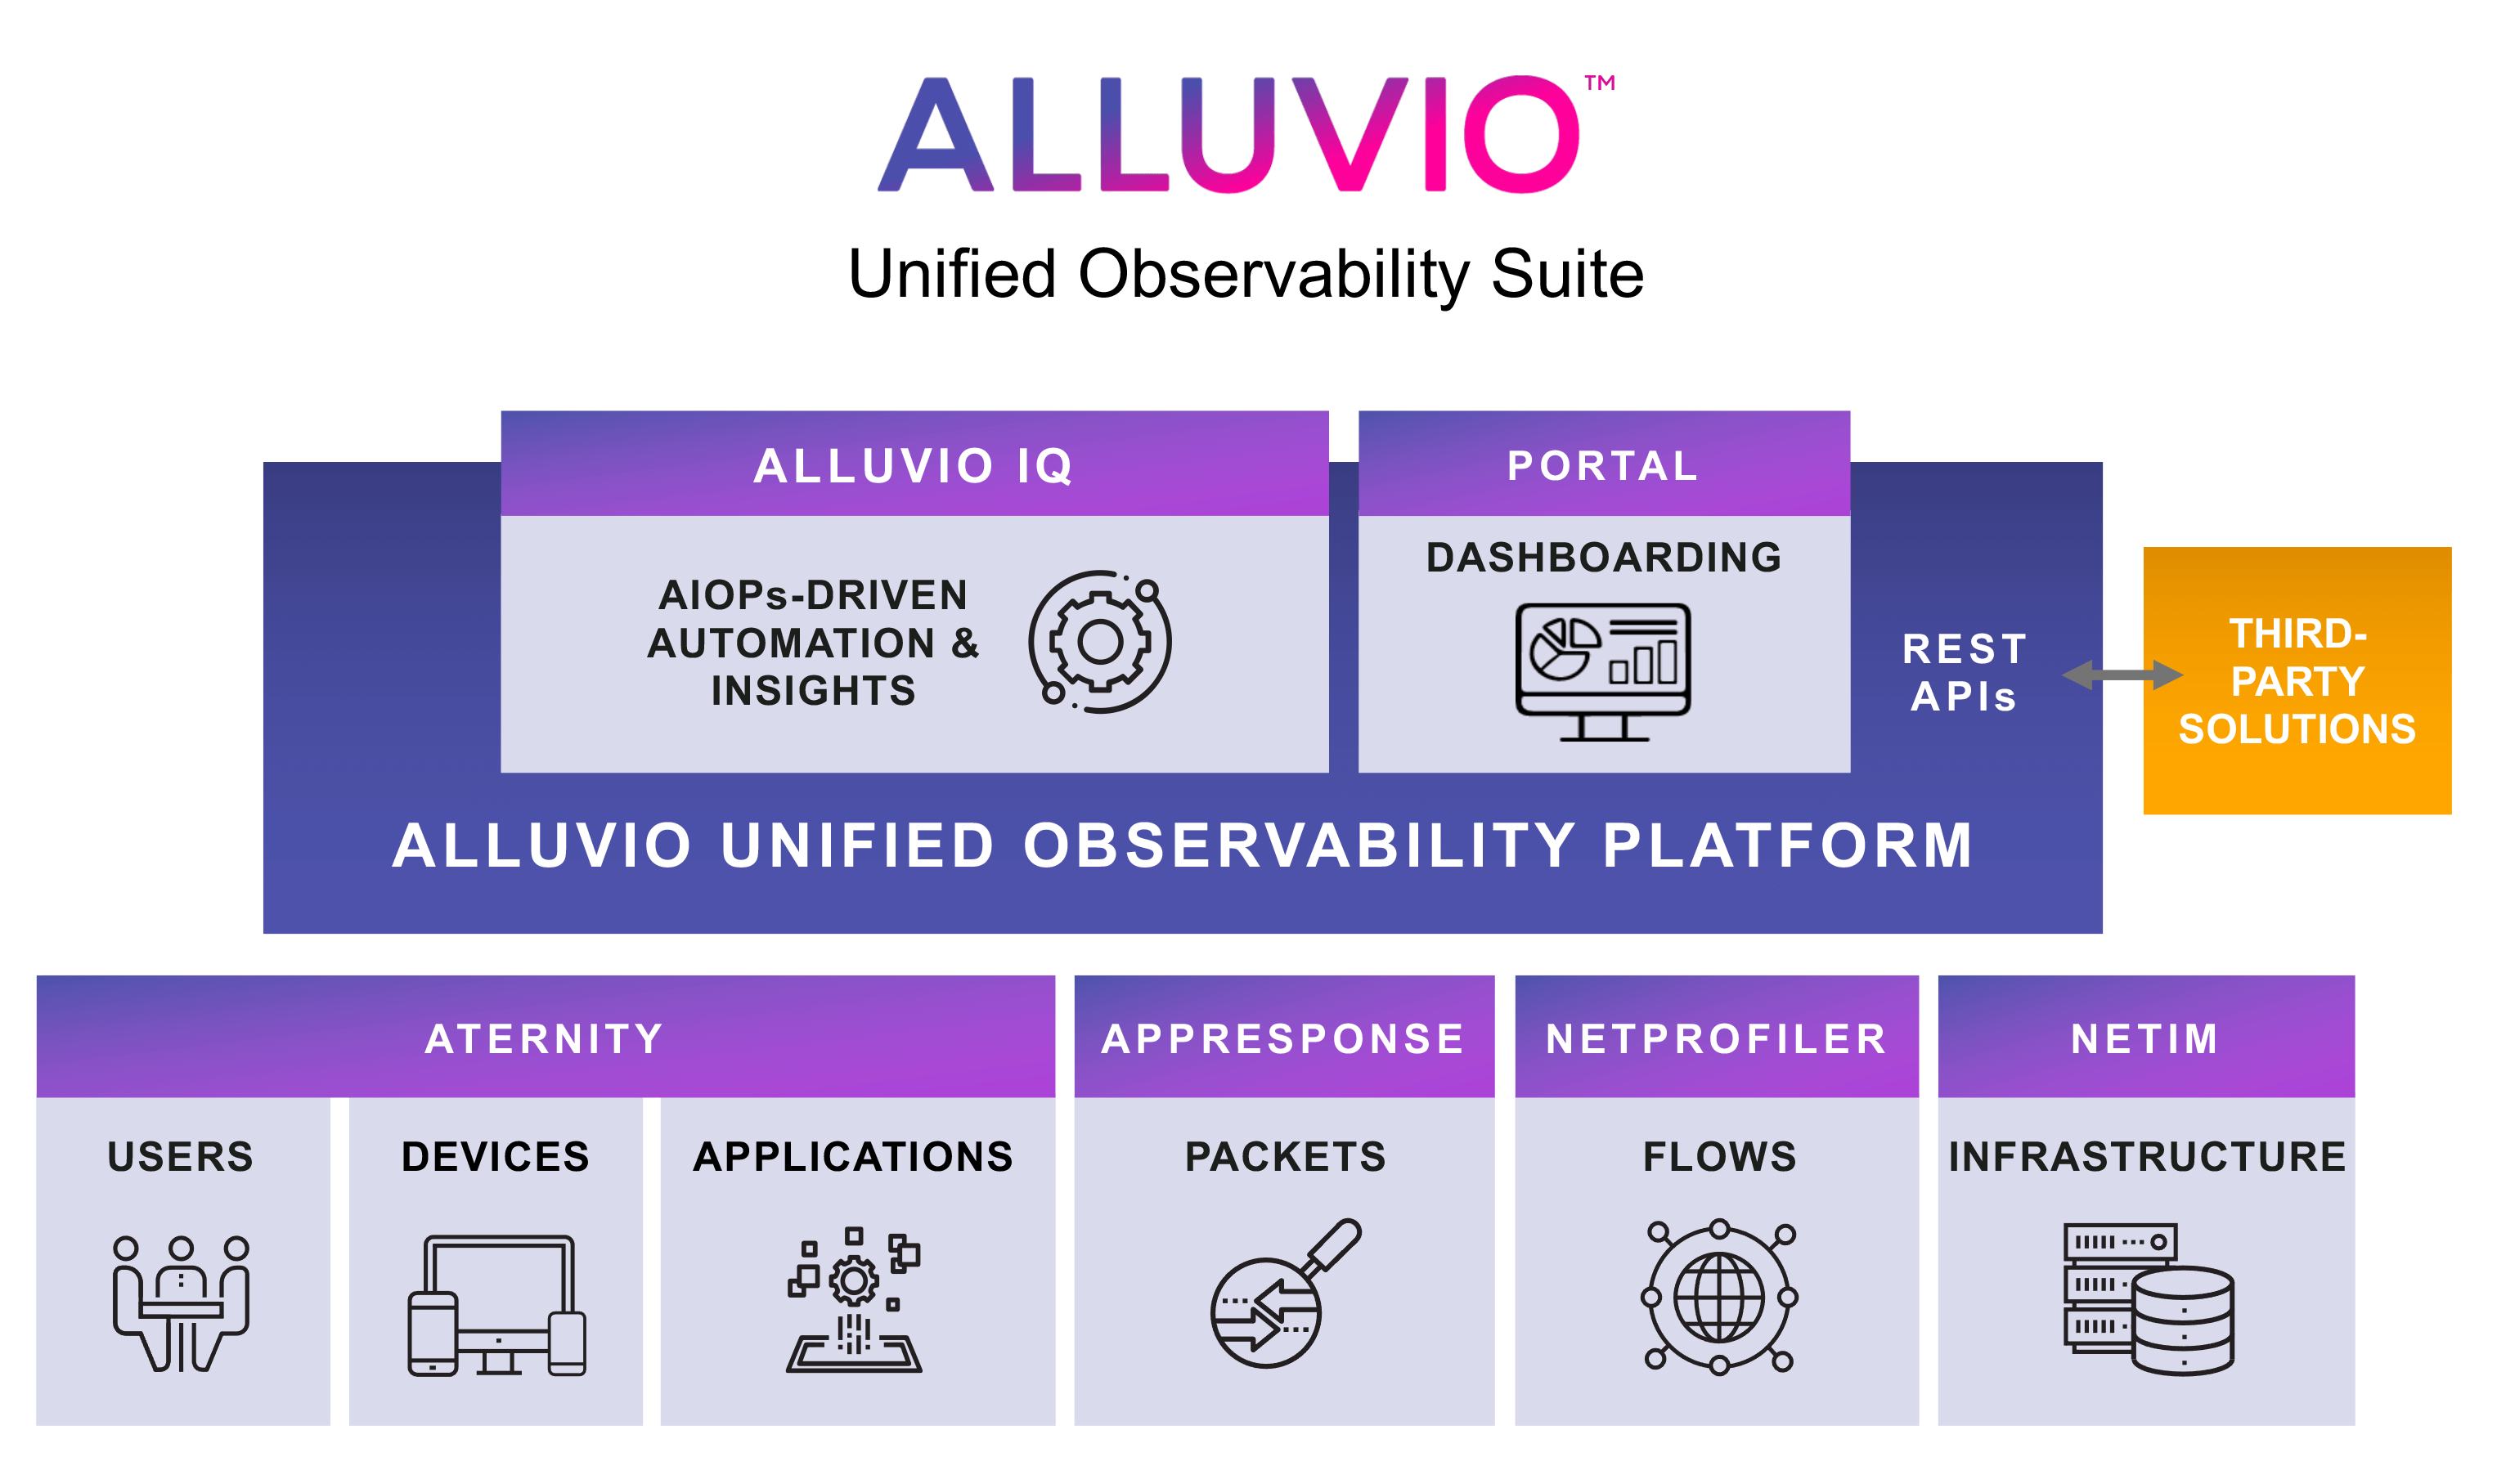
Riverbed Alluvio Product Family
Riverbed Alluvio is a comprehensive set of AI and automation-enhanced Network Performance Management (NPM) and Digital Experience Management (DEM) software. It assists IT teams in making faster decisions, prioritizing actions, and quickly resolving issues.
Riverbed Alluvio Network Performance Management (NPM)
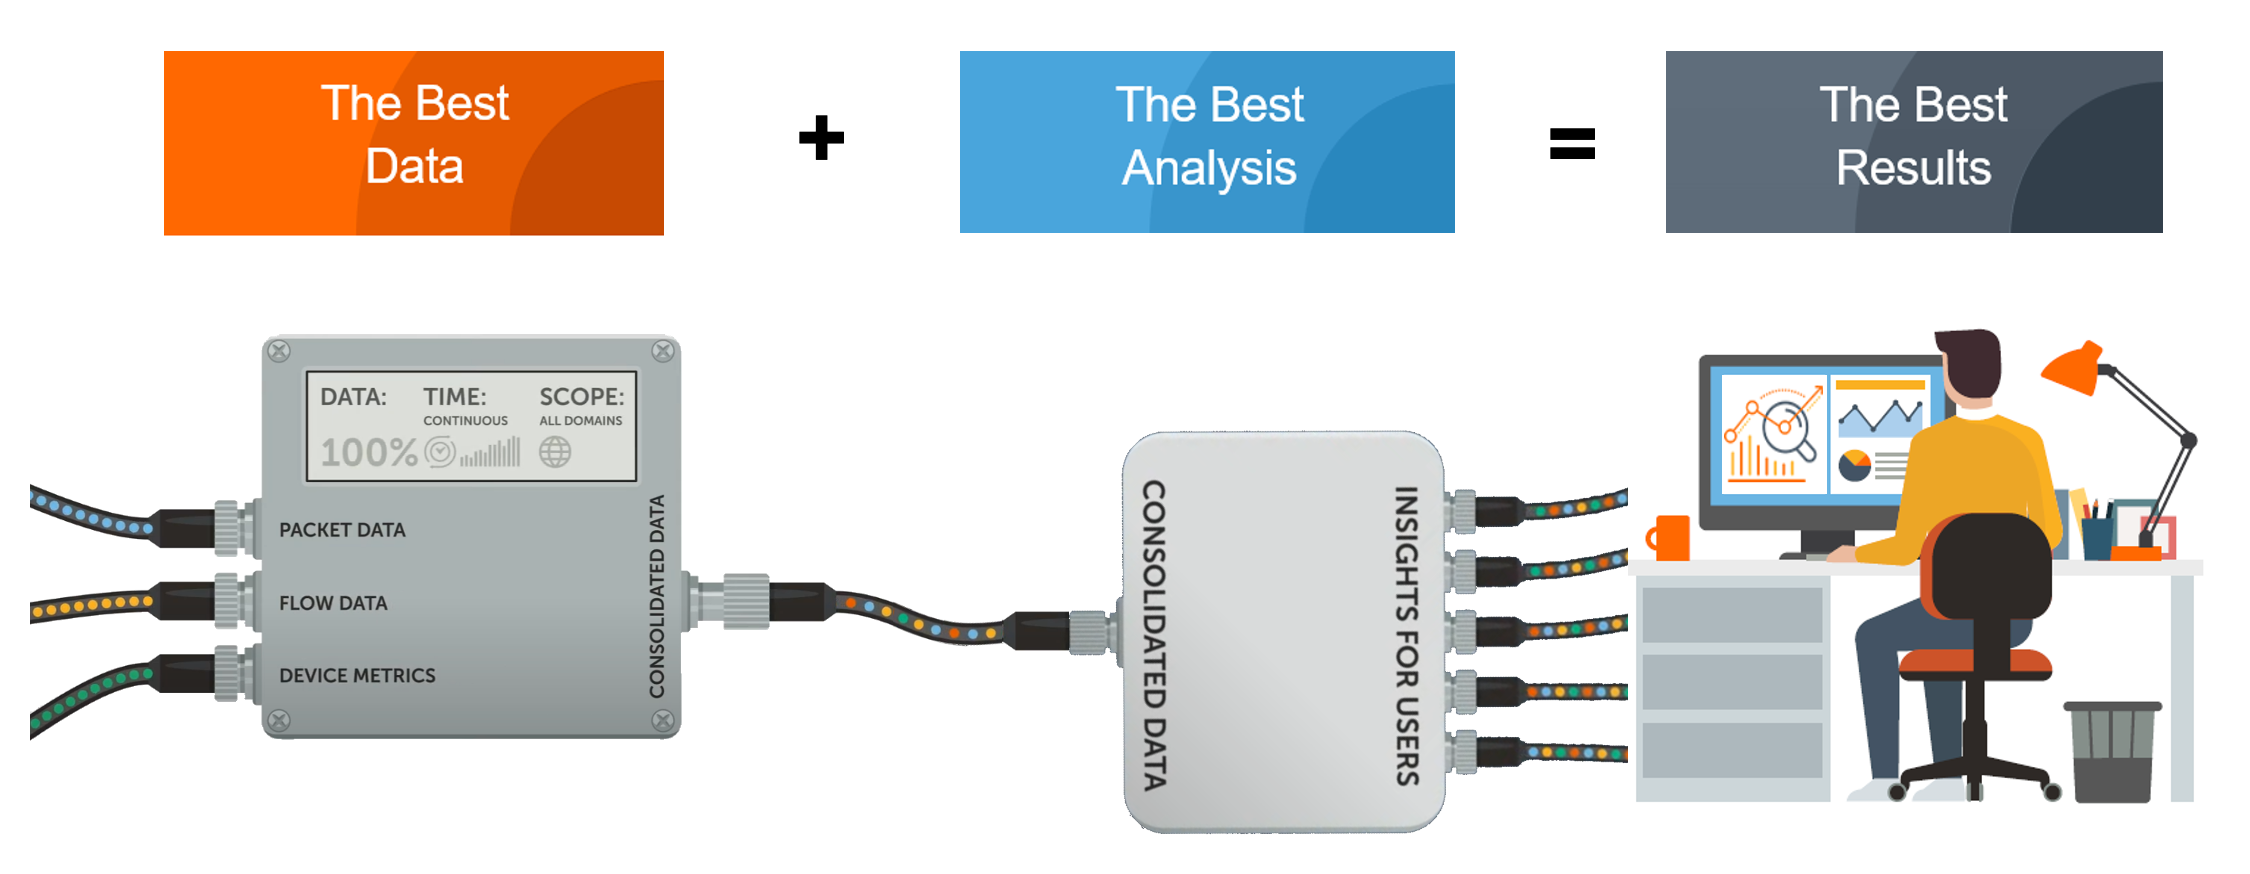
Riverbed Alluvio NPM solutions are modular network monitoring software that integrates with data-sharing integrations. Alluvio NPM supports traditional, cloud, and hybrid network structures. It supports three fundamental network monitoring methods to collect packet, flow, and device metrics. Unlike other NPM solutions, Riverbed solutions consolidate sampled device metrics collected through technologies like SNMP/WMI/Flow with real-time collected live network packet data through mirroring methods (SPAN, etc.), providing reliable and unique outputs.
Riverbed Alluvio NPM Solution Components
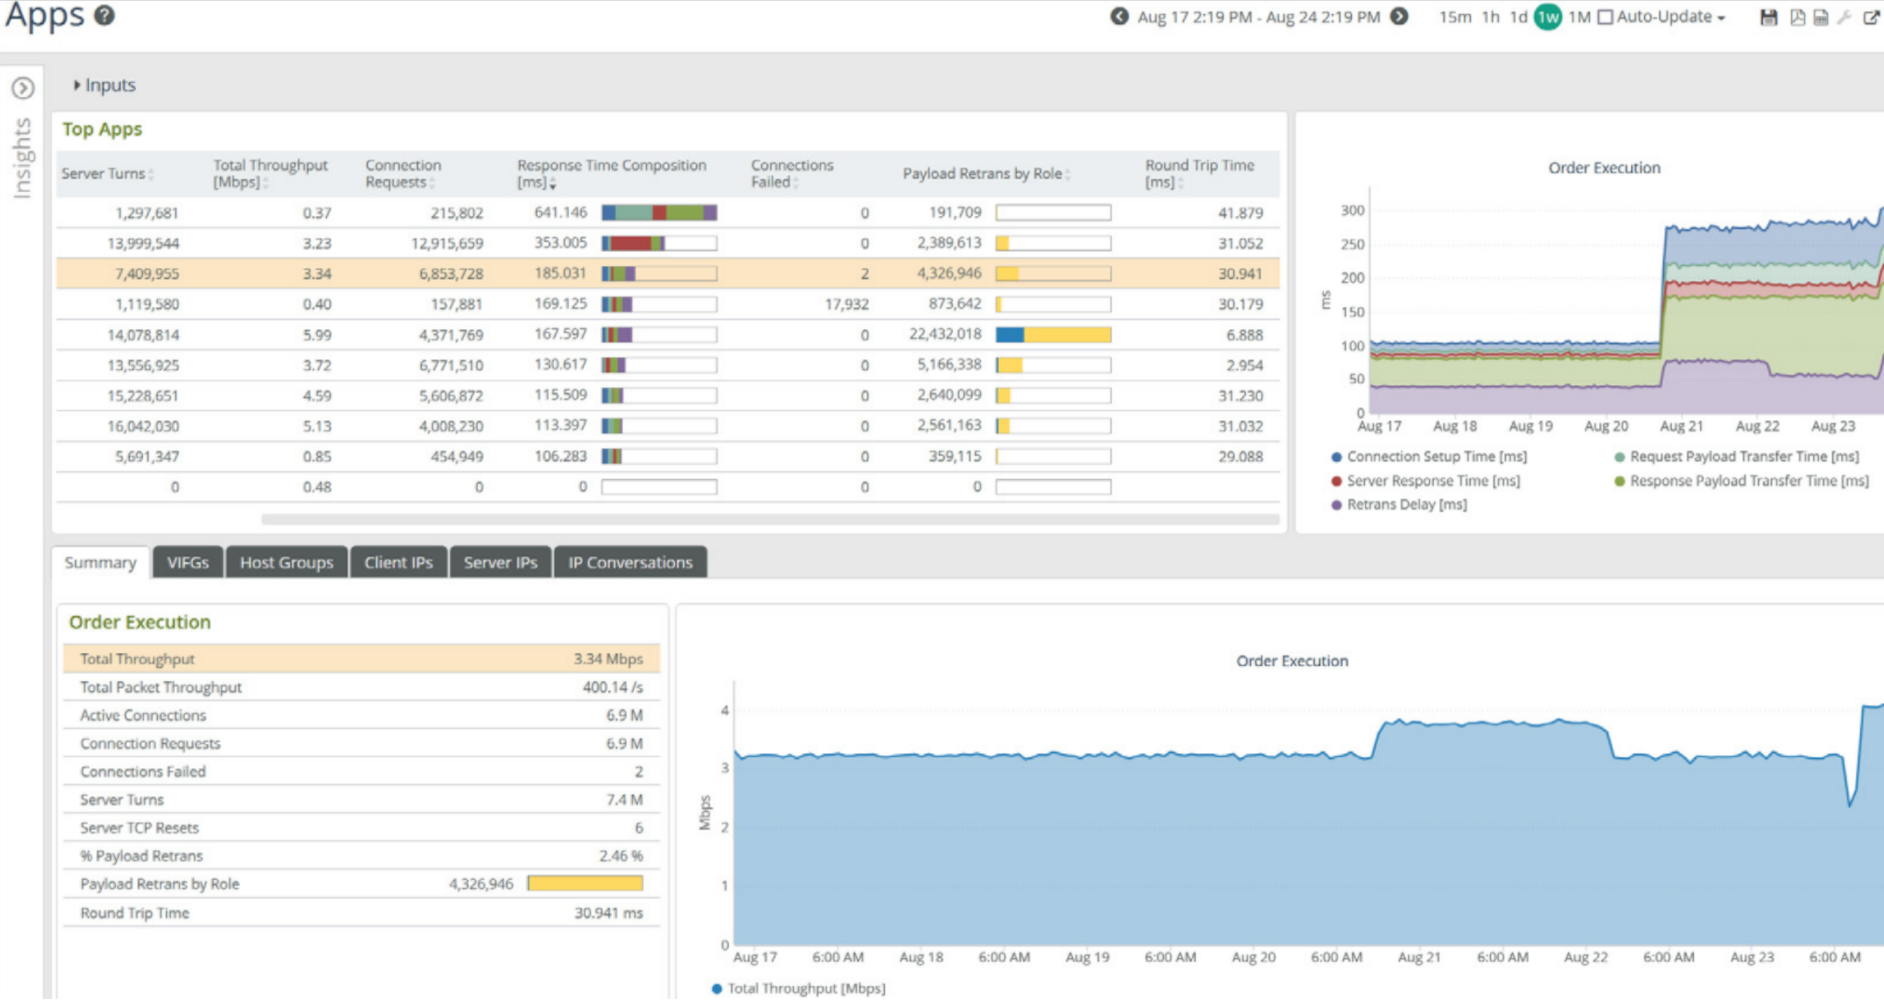
AppResponse
Riverbed Alluvio AppResponse performs network and application performance analysis using network packets collected through mirroring methods (SPAN, etc.). It expedites problem diagnosis and resolution. It stores a copy of directed network packets in formats like pcap, allowing downloads. It facilitates the isolation of issues in multi-layered applications and contributes to root cause analysis. It can show TCP socket details from analyzed network packets, present end-user response times, and breakdowns of server response time and time spent in the network. It reports network error messages, displays DNS query details, and shows outputs like URL, HTTP return code, and page load time with a web analysis module. With a database analysis module, it can provide details of SQL queries.
NetProfiler
Riverbed Alluvio NetProfiler provides centralized flow collection, analysis, and reporting to quickly visualize complex network performance and proactively address performance problems before end-users notice. It can combine flow data with packet-based performance metrics obtained through AppResponse integration for proactive monitoring. NetProfiler can automatically discover and map dependencies to help understand application services. Utilizing artificial intelligence technology based on average application performances can provide alerts on anomalies from the moment service performance starts to degrade. NetProfiler is designed to optimize network performance, capacity planning, and security through flow collection.
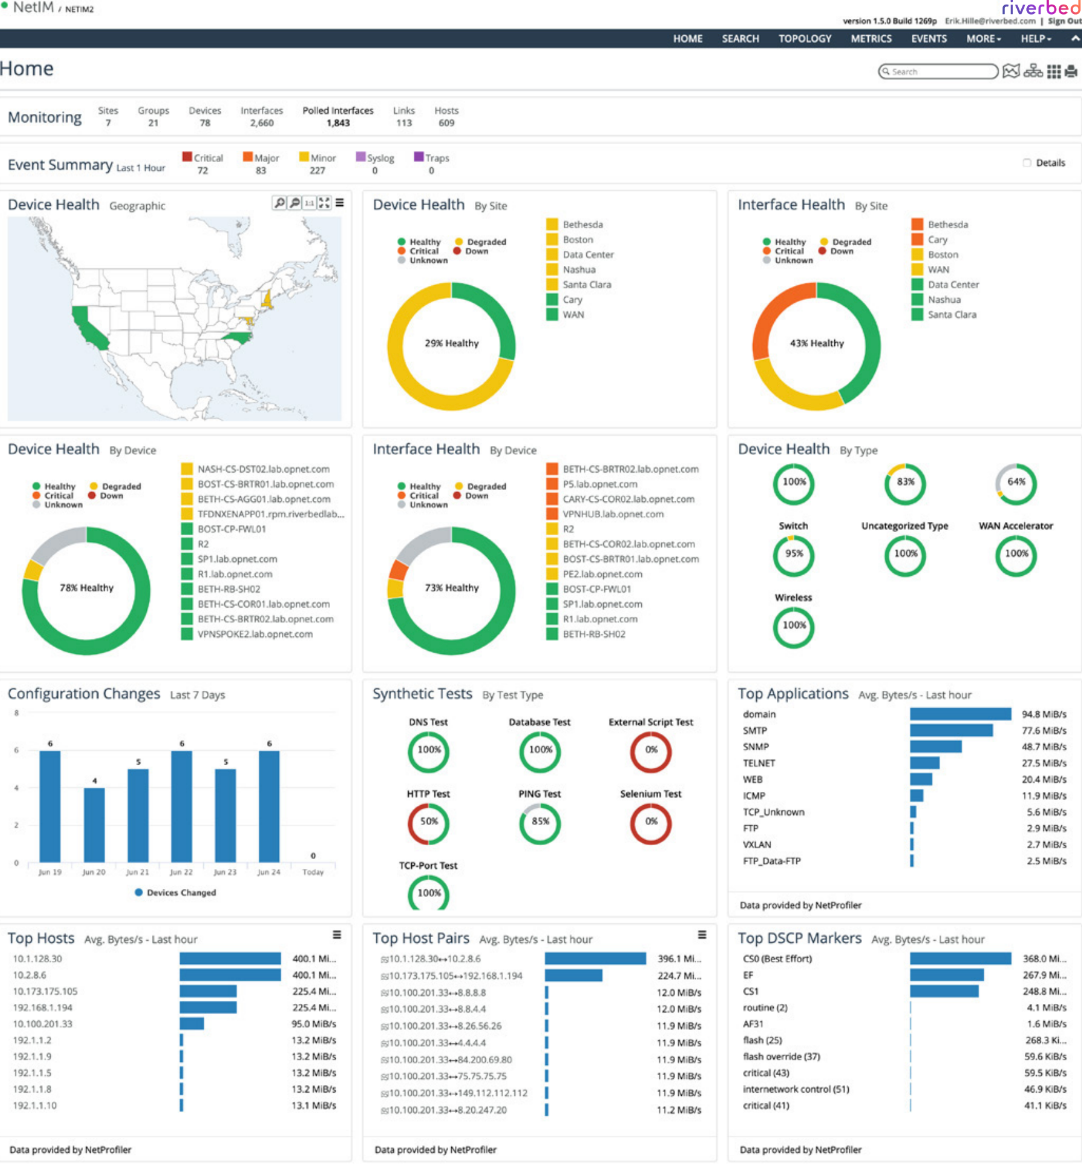
NetIM
Riverbed Alluvio NetIM helps IT staff proactively monitor, discover, and analyze network devices and servers that comprise the infrastructure. It completes Riverbed’s integrated network and application performance visibility through agentless monitoring methods (SNMP, WMI, CLI, API, synthetic tests, etc.). It can take configuration backups of monitored devices and report on network components affecting application performance.
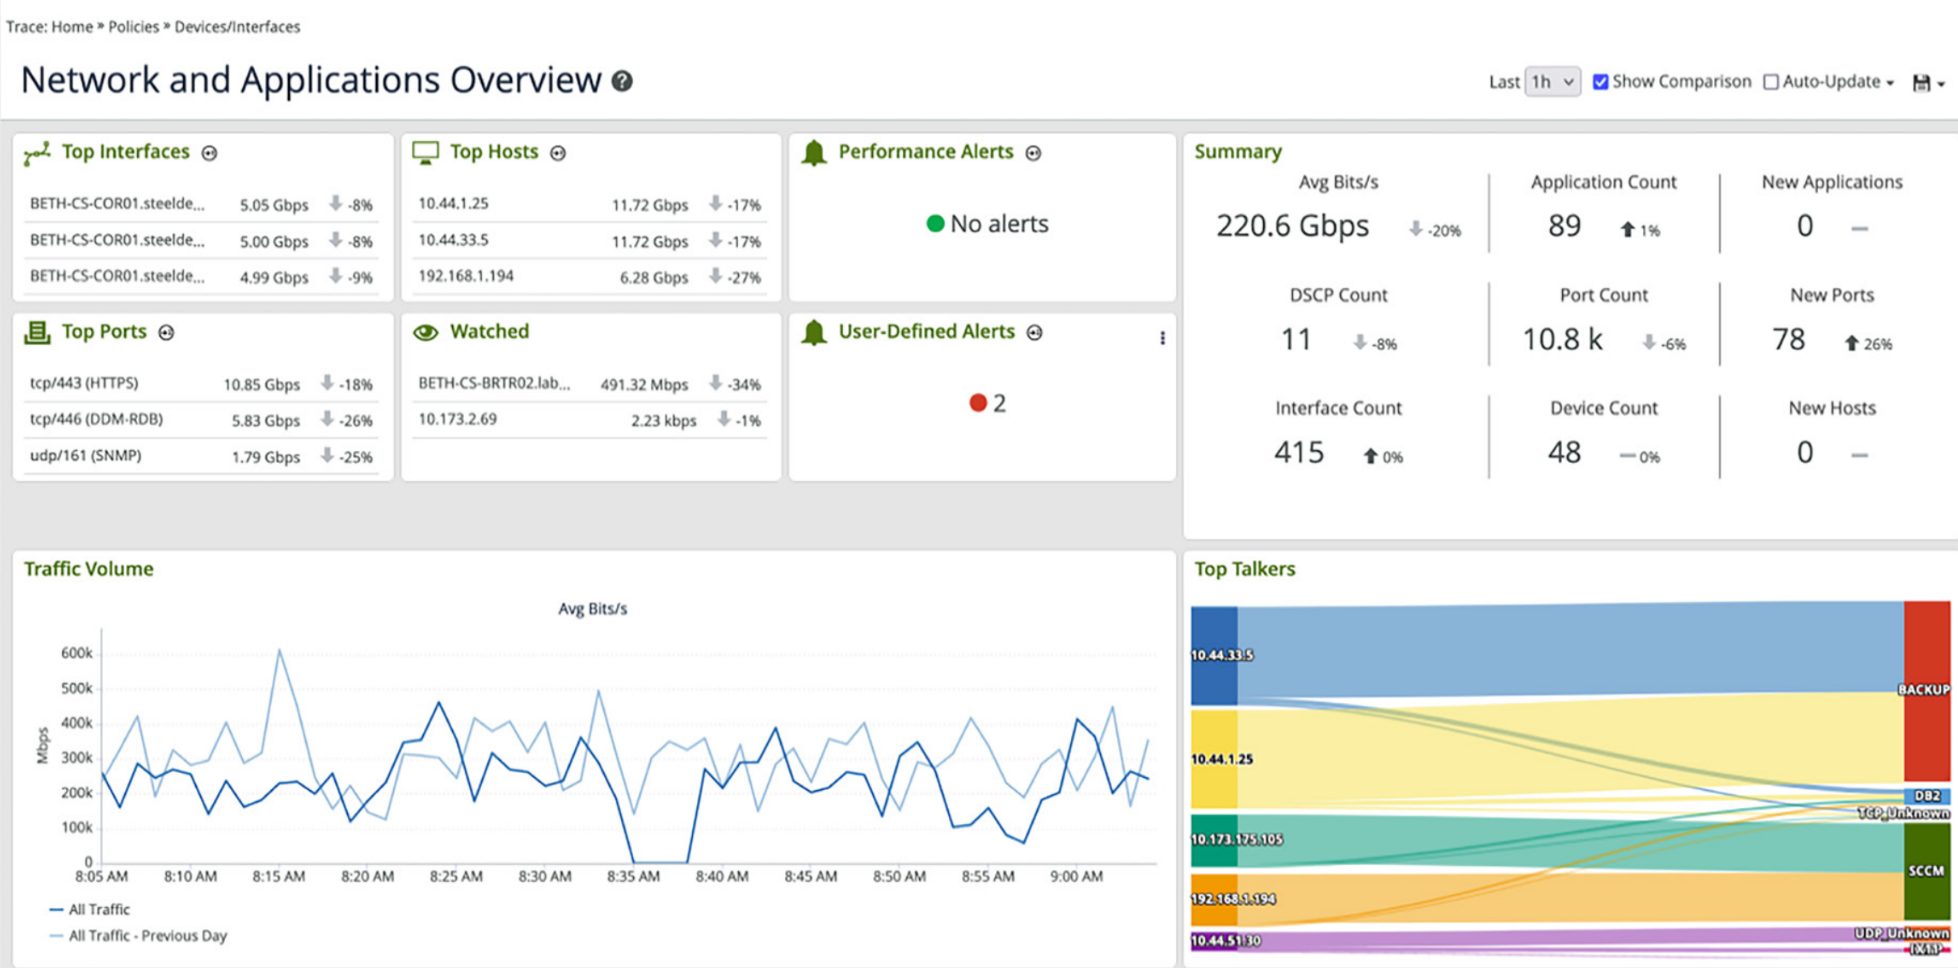
Portal
Riverbed Alluvio Portal is a consolidation and dashboard software that integrates with all software within the Alluvio product family, providing proactive consolidation and display of network, application, and end-user performance data on a single screen. This holistic view allows IT staff to track the performance of their strategic services and perform effective issue analysis.
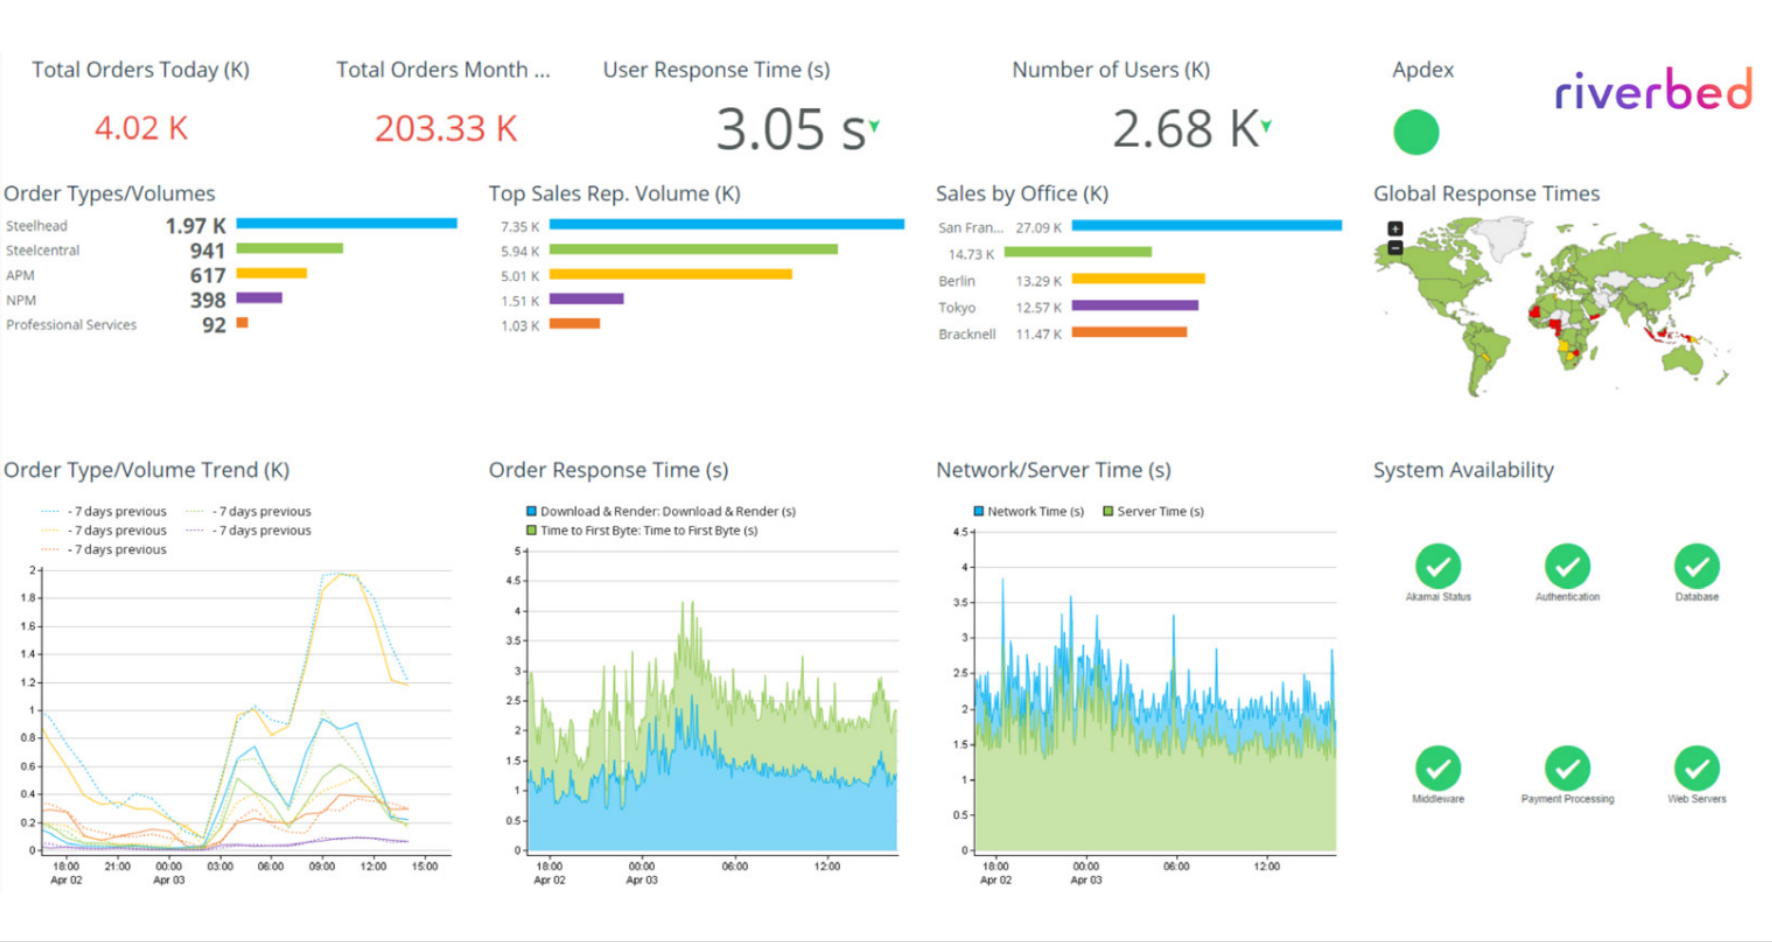
Riverbed Alluvio Digital Experience Management (DEM)
Riverbed Alluvio Aternity solutions monitor application and end-user performance, enabling observation of end-to-end digital experience from the end-user’s device to the data center.
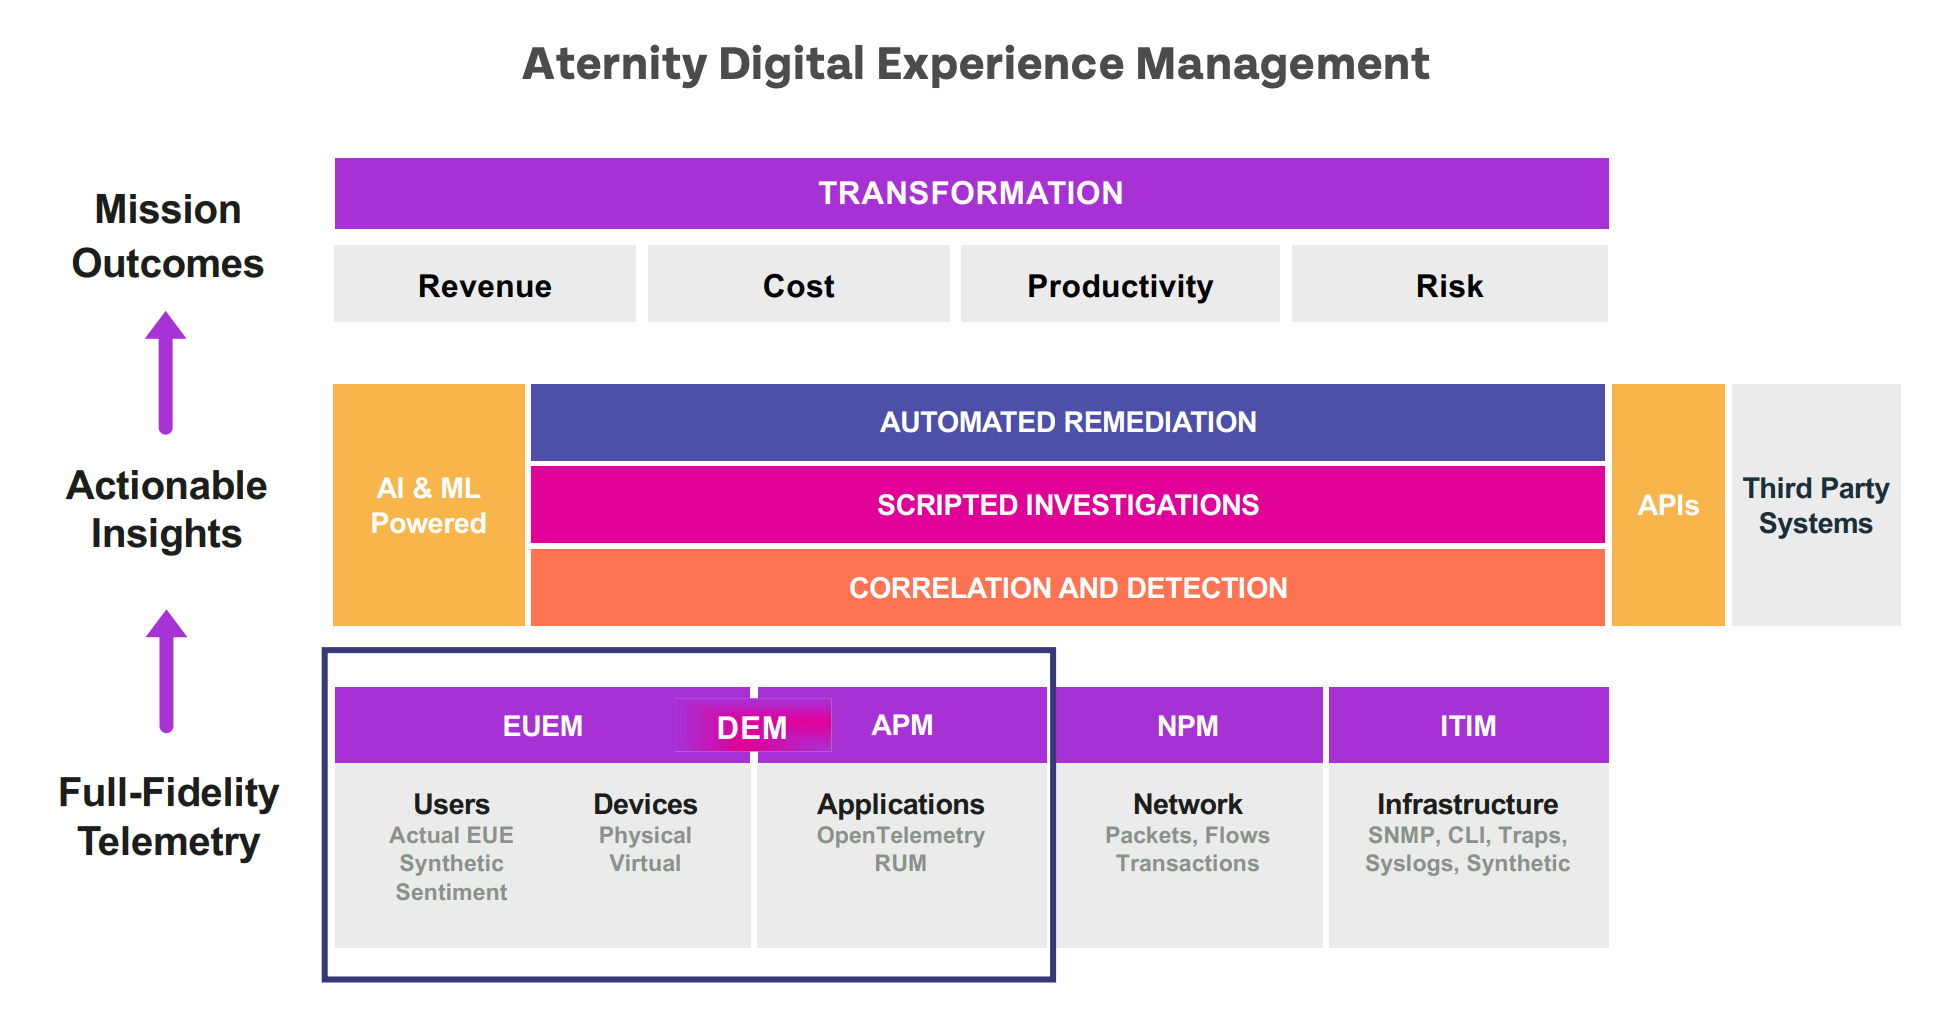
Riverbed Alluvio DEM Solution Components
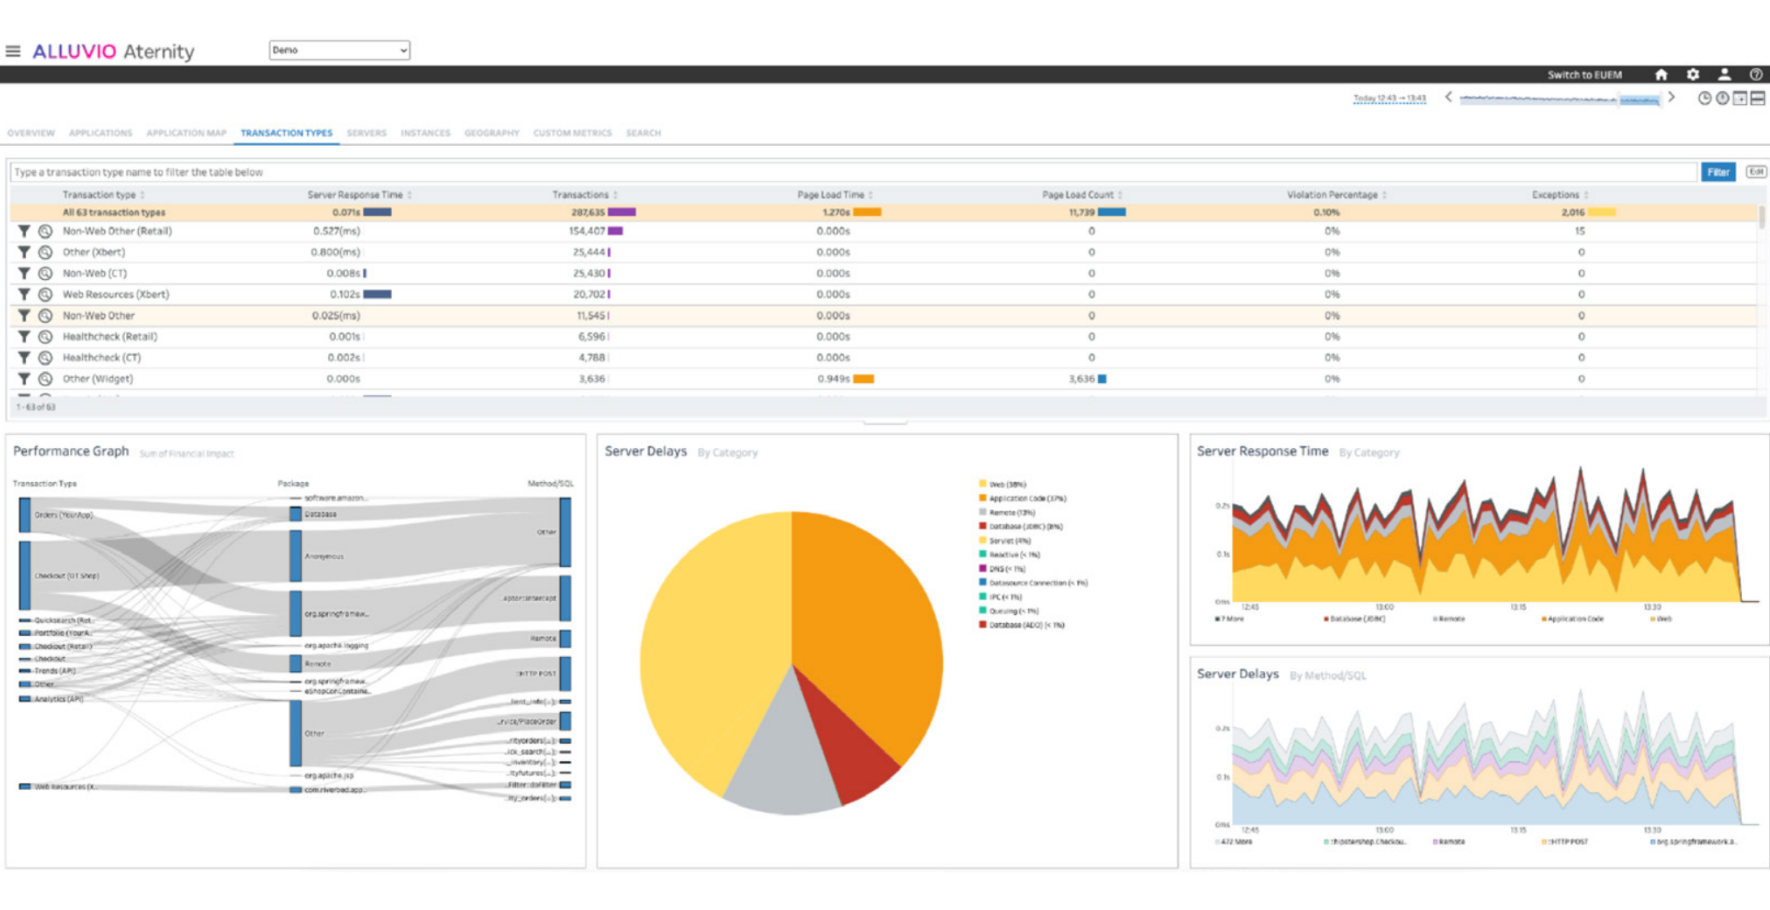
Riverbed Alluvio Aternity APM (Application Performance Monitoring)
Alluvio Aternity APM provides comprehensive application performance monitoring and observability for services running in both cloud and traditional infrastructures.
It detects application dependencies and shows the time spent on code, SQL, and external services.
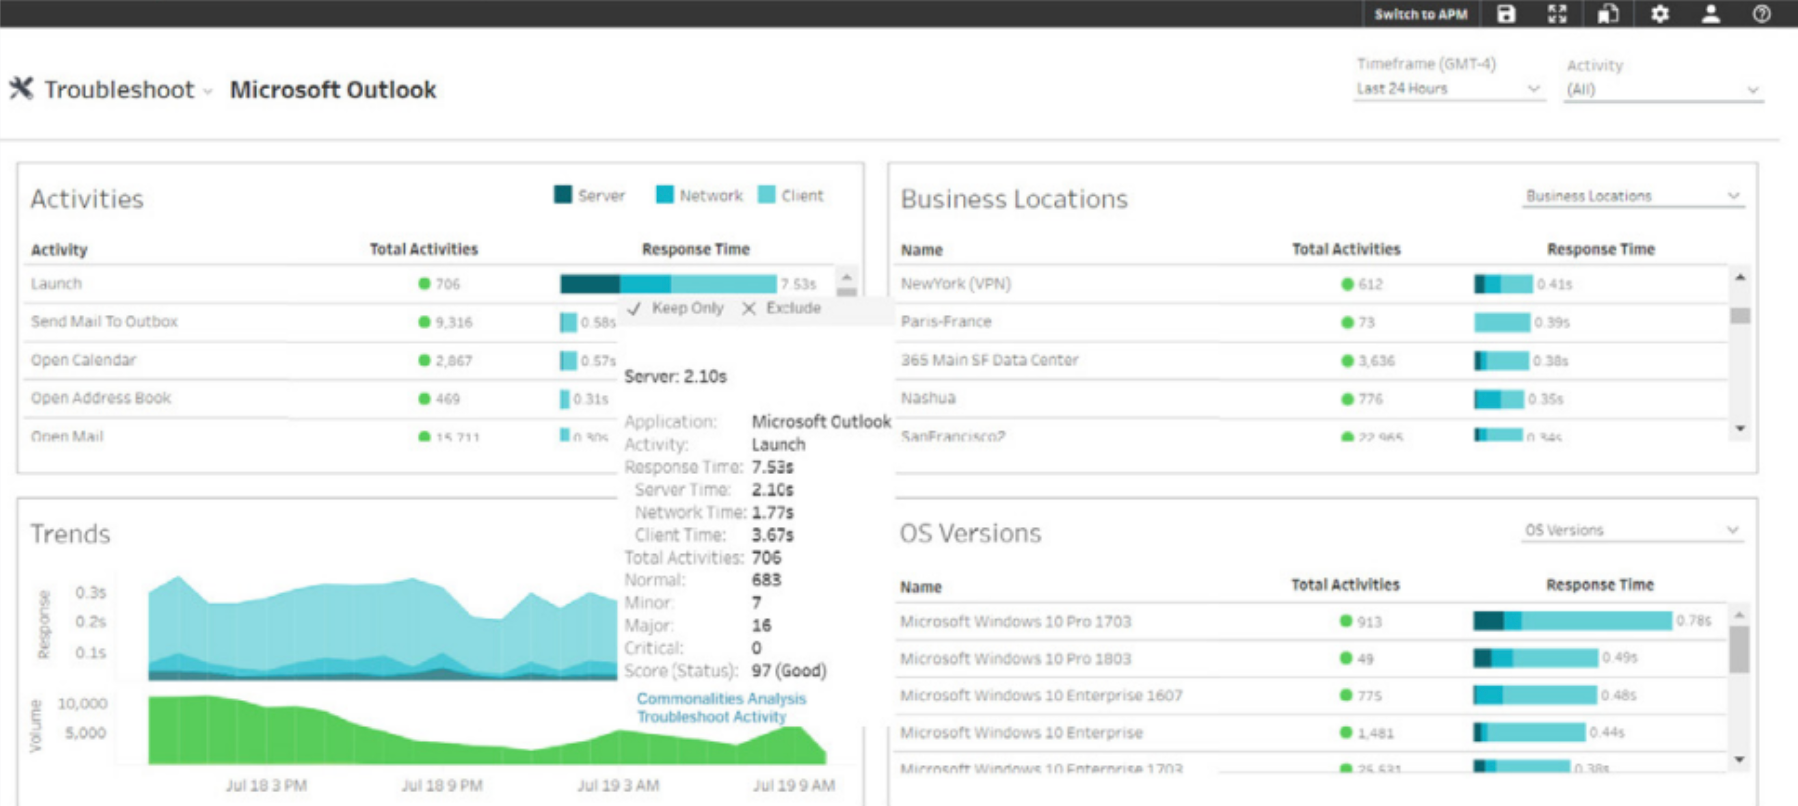
Riverbed Alluvio Aternity EUEM (End-User Experience Monitoring)
Alluvio Aternity EUEM automatically discovers enterprise applications on end-user devices and measures performance from the end-user’s perspective.
It isolates end-user response time into three categories: device, network, and application time, enabling rapid diagnosis and resolution during issues. It helps identify root causes leading to application crashes, freezes, and errors.